Valgrind Massif output analysis tools
Massif is an awesome Valgrind tool when it comes to profile heap usage of a program. Basically, it analyses during the process’s life how many heap memory has been allocated, and the functions responsible of the allocations.
If you were not aware of Massif, please do yourself a favor and take a glance at the documentation
ms_print
A Perl script (well commented) bundled with Valgrind.
The histogram:
- x-axis: number of executed instructions (452.0Mi = 452 millions instructions), default unit, can be overridden to use time instead
- y-axis: memory consumption (here we had a heap size peak of 664.5KB)
- vertical bars are the snapshots taken
    KB
664.5^                                                                       #
     |                                                                       #
     |                                                                  :@:@:#
     |                                                        ::::@::@:@:@:@:#
     |                                               :@::::::::: :@::@:@:@:@:#
     |                                      :::@@@@@@:@: :: : :: :@::@:@:@:@:#
     |                               ::::::::::@ @ @ :@: :: : :: :@::@:@:@:@:#
     |                         :@@@::::::: ::::@ @ @ :@: :: : :: :@::@:@:@:@:#
     |                  ::::@:::@@ : ::::: ::::@ @ @ :@: :: : :: :@::@:@:@:@:#
     |              ::::: : @: :@@ : ::::: ::::@ @ @ :@: :: : :: :@::@:@:@:@:#
     |         @@::@::::: : @: :@@ : ::::: ::::@ @ @ :@: :: : :: :@::@:@:@:@:#
     |       ::@ : @::::: : @: :@@ : ::::: ::::@ @ @ :@: :: : :: :@::@:@:@:@:#
     |    :::: @ : @::::: : @: :@@ : ::::: ::::@ @ @ :@: :: : :: :@::@:@:@:@:#
     |    : :: @ : @::::: : @: :@@ : ::::: ::::@ @ @ :@: :: : :: :@::@:@:@:@:#
     |    : :: @ : @::::: : @: :@@ : ::::: ::::@ @ @ :@: :: : :: :@::@:@:@:@:#
     |    : :: @ : @::::: : @: :@@ : ::::: ::::@ @ @ :@: :: : :: :@::@:@:@:@:#
     |    : :: @ : @::::: : @: :@@ : ::::: ::::@ @ @ :@: :: : :: :@::@:@:@:@:#
     |  ::: :: @ : @::::: : @: :@@ : ::::: ::::@ @ @ :@: :: : :: :@::@:@:@:@:#
     |  ::: :: @ : @::::: : @: :@@ : ::::: ::::@ @ @ :@: :: : :: :@::@:@:@:@:#
     |  ::: :: @ : @::::: : @: :@@ : ::::: ::::@ @ @ :@: :: : :: :@::@:@:@:@:#
   0 +----------------------------------------------------------------------->Mi
     0                                                                   452.0
(...)
After the histogram every snapshot is explained in details. The tree structure makes easy to see how memory allocations breaks down over allocating functions.
Extract of the first snapshot:
77.83% (265,799B) (heap allocation functions) malloc/new/new[], --alloc-fns, etc.
->40.31% (137,664B) 0x4E6230F: xcalloc (alloc.c:51)
| ->20.03% (68,400B) 0x4E9D4F0: PrependItem (item_lib.c:297)
| | ->20.01% (68,352B) 0x4E62756: PrependAlphaList (alphalist.c:127)
| | | ->20.01% (68,352B) 0x4E757B1: NewClass (env_context.c:422)
| | |   ->19.41% (66,288B) 0x4E7E7D6: ModuleProtocol (evalfunction.c:4168)
| | |   | ->19.41% (66,288B) 0x409EB1: VerifyExec (verify_exec.c:252)
| | |   |   ->19.41% (66,288B) 0x40A409: VerifyExecPromise (verify_exec.c:50)
| | |   |     ->19.41% (66,288B) 0x4073FF: KeepAgentPromise (cf-agent.c:1102)
| | |   |       ->19.41% (66,288B) 0x4E8131B: ExpandPromiseAndDo (expand.c:713)
| | |   |         ->19.41% (66,288B) 0x4E81640: ExpandPromise (expand.c:140)
| | |   |           ->19.41% (66,288B) 0x40864C: ScheduleAgentOperations (cf-agent.c:921)
| | |   |             ->19.41% (66,288B) 0x406B9D: main (cf-agent.c:866)
| | |   |
| | |   ->00.60% (2,064B) in 1+ places, all below ms_print's threshold (01.00%)
| | |
| | ->00.01% (48B) in 1+ places, all below ms_print's threshold (01.00%)
| |
| ->19.19% (65,536B) 0x4E9B882: HashInsertElement (hashes.c:95)
:
(...)
What does 77.83% (265,799B) on the first line stands for ? Why not 100% ? The recapitulation table above the histogram (also given by ms_print) helps to understand:
--------------------------------------------------------------------------------
  n        time(i)         total(B)   useful-heap(B) extra-heap(B)    stacks(B)
--------------------------------------------------------------------------------
  0              0                0                0             0            0
  1      8,880,356              584              568            16            0
  2     13,579,590          123,184           80,499        42,685            0
  3     21,801,661          124,000           81,305        42,695            0
  4     32,406,685          272,680          213,796        58,884            0
  5     41,997,645          298,440          233,116        65,324            0
  6     52,656,592          319,960          249,369        70,591            0
  7     60,273,737          332,920          259,251        73,669            0
  8     65,706,612          341,520          265,799        75,721            0
77.83% (265,799B) is the useful-heap part of total (341,520) heap size. extra-heap is the overhead involved by memory management (housekeeping structures, …)
Massif Visualizer
Massif Visualizer is a neat-looking GUI interface:
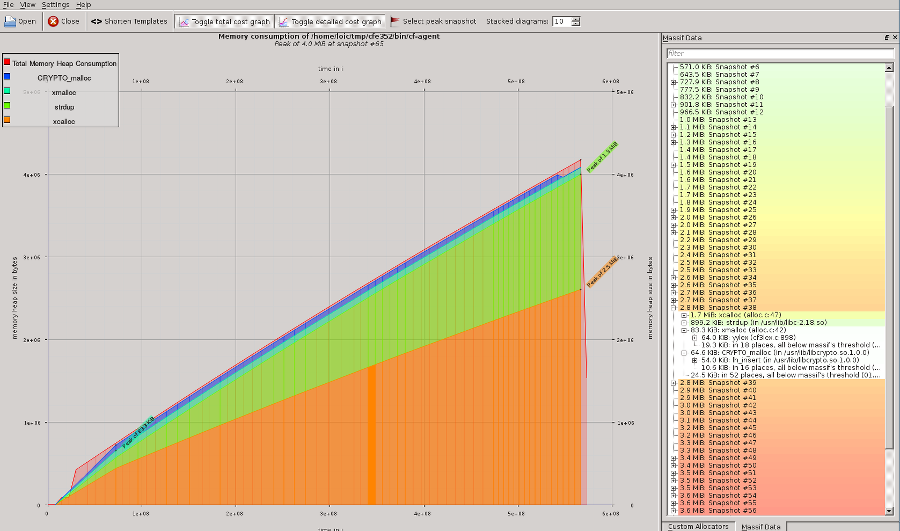
Each snapshot is accessible through the list widget on the right, and once selected, highlight its own area over the graph. Links:
Notes
If you are aware of another Massif reports visualizer, please leave a comment!